 快速上手
快速上手
# 如何使用
# 1. 页面定义一个画布包裹层元素(需要指定宽、高样式属性)
`<div id="graph-container" style="width:100%;height:500px;"></div>`
# 2. 页面引入GraphVis组件库文件
`<script src="static/libs/graphVis.min.js"></script>`
# 3. 创建GraphVis客户端对象,调用接口添加图数据
let graphVis = new GraphVis({
    container:document.getElementById('graph-container'), //画布层
    licenseKey:'licensekey', //授权license
    config:{} //可视化统一配置
});

// 添加图数据
graphVis.addGraph({
	nodes:[{id:1000,label:'节点一'},{id:2000,label:'节点二'}],
	links:[{id:'e1',source:1000,target:2000,label:'关系'}]
});
1
2
3
4
5
6
7
8
9
10
11
2
3
4
5
6
7
8
9
10
11
# 完整页面应用示例
<!DOCTYPE html>
<html>
	<head>
		<meta charset="utf-8">
		<title>GraphVis图可视化</title>
	</head>
	<body>
		<div id="graph-container" style="width: 100%;height:500px;"></div>
	</body>

	<!-- 引用组件库文件 -->
	<script src="graphvis.min.js"></script>
	<script type="text/javascript">
		let graphVis = new GraphVis({
			container:document.getElementById('graph-container'), //图可视化区域包裹层
			licenseKey:'licensekey' //授权license
		}); //初始化客户端

        //示例图数据
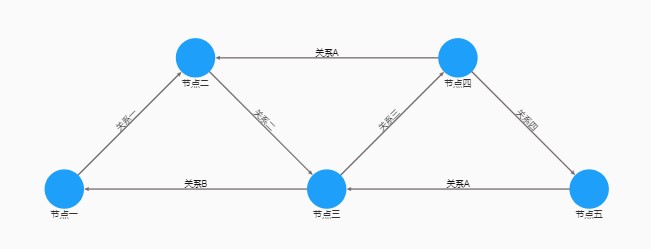
		const data = {
			nodes: [
				{ id: 1000, label: '节点一', y: 300, x: 200,type:'type1' },
				{ id: 2000, label: '节点二', y: 100, x: 400,type:'type1' },
				{ id: 3000, label: '节点三', y: 300, x: 600,type:'type2' },
				{ id: 4000, label: '节点四', y: 100, x: 800,type:'type2' },
				{ id: 5000, label: '节点五', y: 300, x: 1000,type:'type3' }
			],
			links: [
				{ id: 'e-10', source: 1000, target: 2000, label: '关系一'},
				{ id: 'e-20', source: 2000, target: 3000, label: '关系二'},
				{ id: 'e-30', source: 3000, target: 4000, label: '关系三'},
				{ id: 'e-40', source: 4000, target: 5000, label: '关系四'},
				{ id: 'e-50', source: 4000, target: 2000, label: '关系A'},
				{ id: 'e-60', source: 3000, target: 1000, label: '关系B'},
				{ id: 'e-70', source: 5000, target: 3000, label: '关系A'}
			]
		};

		graphVis.addGraph(data); //添加图数据
		graphVis.zoomFit(); //居中显示

	</script>

</html>
1
2
3
4
5
6
7
8
9
10
11
12
13
14
15
16
17
18
19
20
21
22
23
24
25
26
27
28
29
30
31
32
33
34
35
36
37
38
39
40
41
42
43
44
2
3
4
5
6
7
8
9
10
11
12
13
14
15
16
17
18
19
20
21
22
23
24
25
26
27
28
29
30
31
32
33
34
35
36
37
38
39
40
41
42
43
44
# 可视化结果
