 节点模板配置
# 节点模板配置
提示
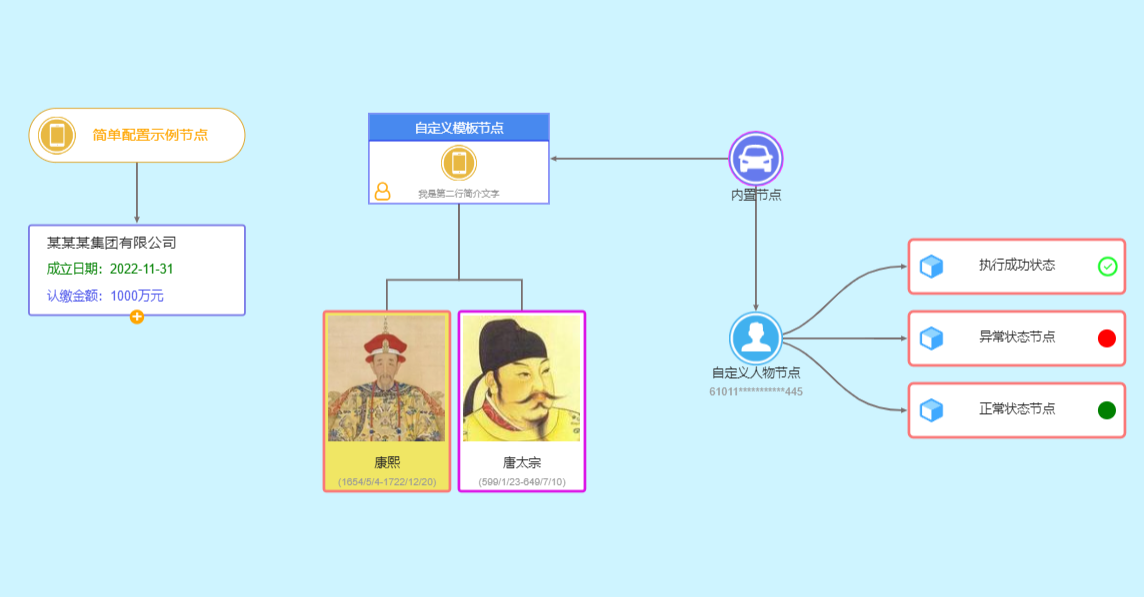
各类产品对于图谱可视化展示的需求都不尽相同,组件内置的节点效果无法满足所有产品的使用需要,所以组件提供了自定义配置节点显示效果的方法,按照节点模板的配置定义规范,可以实现多种多样,内容丰富的节点效果,满足各类产品的使用需要。
# 如何定义节点模板
- 首先定义节点的模板结构,模板结构由一个主形状 mainShape(圆形或者矩形),以及分布在形状上或者周围的元素elements组成。
- 周围的元素类型支持:圆形、矩形、连线、文字、图片、字体图标icon、自定义绘制等几种类型。
- 主形状上元素的位置采用坐标定位的方式指定,位置都是相当于主形状中心位置[0,0]的偏移坐标。
# 配置示例说明
此处使用一个示例演示一个矩形节点的配置,实现丰富的展示样式定义。
const nodeTemplates = [{
    name:'custome-nodeA', //节点模板的名称(需保证唯一)
    mainShape:{         //主形状定义(此处为)
        type:'rect',    // 支持rect和circle两种
        width: 100,     // 矩形的宽
        height: 40,     // 矩形的高
        fillColor:'50,50,230', // 填充色
        borderWidth:0,     //边框宽度
        borderColor:'50,50,240', //边框颜色
        borderRadius:0,    //圆角大小
        alpha:1,           //透明度
        selectedBorderWidth:2,  //选中时边框的宽度
        selectedBorderColor:'120,120,230' //选中时边框的颜色
    },
    elements:[      //形状上附加的显示元素
        {
            type:'circle', //元素的类型:圆形,支持circle|rect
            attrs:{        //元素的属性
                radius: 10,  //圆的半径
                x: 20,     // 距离主元素中心位置的横向偏移量
                y: 20,    // 距离主元素中心位置的纵向偏移量
                fillColor:'250,50,230', //圆形填充色
                borderWidth:1,  //圆形边框宽度
                borderColor:'50,50,240' //边框颜色
            }
        },
        {
            type:'image', //图片元素
            attrs:{
                inmageUrl:'/image/1.png', //图片的路径,也可用方法获取节点属性function(node){}
                width: 10, //图片的宽度
                height: 10, //图片的高度
                x: 20, //距离中心的位置
                y: 20
            }
        },
        {
            type:'line',  //画一条连线
            attrs:{
                x1: 10,  //连线的起点和终点坐标
                y1: 10,
                x2: 90,
                y2: 10,
                lineWidth:1, //连线的宽度
                color:'#ddd', //连线的颜色
            }
        },
        {
            type:'text',  //文字元素
            attrs:{
                x: 10,  //文字的位置
                y: 10,
                textAlign:'center', //对齐方式
                baseLine:'middle',  //基线类型
                color:'#ddd',       //文字的颜色
                font: 'noraml 16px Yahei', //文字样式定义
                content:function(node){   //显示的文字内容,获取节点的某个属性
                    return '绘制的文字';
                }
            }
        },
        {
            type:'icon', // icon类型,与图片类似,需要事先注册图标图片
            attrs:{
                iconName:'people', // icon的类型名称
                width: 10,    // 宽高以及坐标
                height: 10,
                x: 20,
                y: 20
            }
        },
        {
            type:'defined',  //自定义元素
            attrs:{
                drawFunction:function(ctx,node){  //定义自定义绘制方法,如下:根据节点的属性绘制不同颜色的圆形
                    ctx.beginPath();
                    ctx.arc(100,0,10,0,Math.PI*2,false);
                    ctx.fillStyle = node.properties.status =='error'?'red':'green';
                    ctx.fill();
                }
            }
        }
    ]
}];
1
2
3
4
5
6
7
8
9
10
11
12
13
14
15
16
17
18
19
20
21
22
23
24
25
26
27
28
29
30
31
32
33
34
35
36
37
38
39
40
41
42
43
44
45
46
47
48
49
50
51
52
53
54
55
56
57
58
59
60
61
62
63
64
65
66
67
68
69
70
71
72
73
74
75
76
77
78
79
80
81
82
83
84
85
2
3
4
5
6
7
8
9
10
11
12
13
14
15
16
17
18
19
20
21
22
23
24
25
26
27
28
29
30
31
32
33
34
35
36
37
38
39
40
41
42
43
44
45
46
47
48
49
50
51
52
53
54
55
56
57
58
59
60
61
62
63
64
65
66
67
68
69
70
71
72
73
74
75
76
77
78
79
80
81
82
83
84
85
# 如何使用节点模板
- 1、在初始化完成GraphVis客户端后,调用接口 registNodeTemplates(templates) 将定义的模板注册进去。
- 2、在数据中需要指定 nodeType='custome' 和 shape='custome-nodeA' 两个属性,指明节点类型为自定义,形状为注册的名称即可。
- 3、添加图数据,即可显示自定义的形状
let graphVis = new GraphVis({
    container:document.getElementById('graph-container'),
    licenseKey:'licenseKey',
    config: null
});

//注册节点自定义模板
graphVis.registNodeTemplates(nodeTemplates);

//示例:添加一个自定义类型的节点
graphVis.addNodes([
    {
        id:111,
        label:'自定义模板节点',
        nodeType:'custome', //标识为自定义节点
        shape:'custome-nodeA', //自定义的形状名称
        style:{
            x: 700,
            y: 180
        }
    }
]);
1
2
3
4
5
6
7
8
9
10
11
12
13
14
15
16
17
18
19
20
21
22
2
3
4
5
6
7
8
9
10
11
12
13
14
15
16
17
18
19
20
21
22
# 自定义节点模板实现的节点效果

